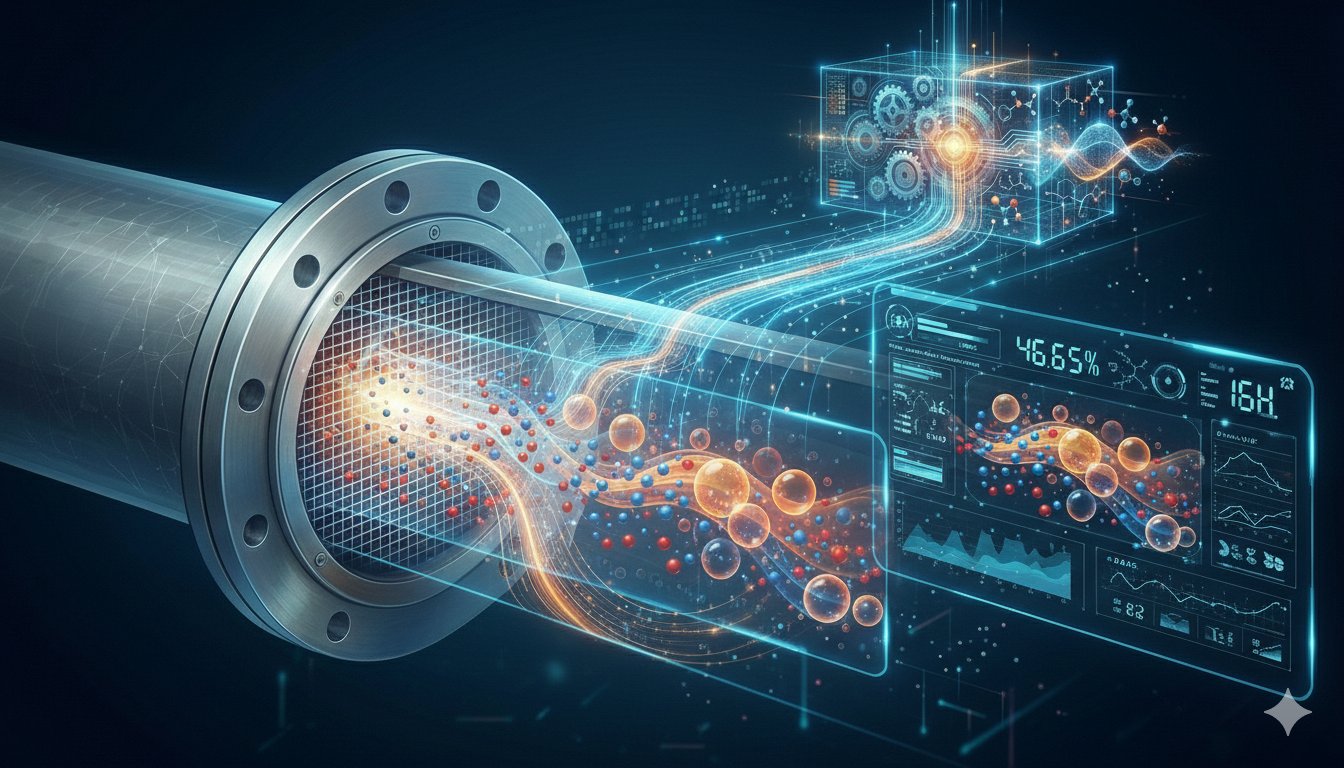
Real-time spatial visibility inside reactors, columns, and pipes — without stopping production. Built for process engineers who need to understand what's actually happening, not just what wall sensors imply.
Pressure, temperature, and flow sensors report what's happening at a single point — or at the pipe wall. But the physics that determines yield, quality, and stability happens inside the process: how phases distribute, how mixing propagates, where instabilities form.
Without spatial visibility, engineers manage by proxy. The result: conservative setpoints, late detection of off-spec conditions, over-engineered safety margins, and process knowledge that stays in people's heads rather than in systems that can learn.
Wall sensors miss the spatial dynamics that determine mixing quality, phase distribution, and reaction uniformity across the cross-section.
Foaming, channeling, and phase instabilities are invisible until they reach product quality — by which point intervention is already costly.
Without knowing the actual process state, operators run longer than necessary — wasting energy and capacity on every batch.
Process expertise stays with individuals. It cannot be encoded, transferred across sites, or used to train the next generation of controls.
Inline spatial monitoring solves fundamentally different problems depending on the process. Select your context.
Gas distribution, bubble size, and mixing uniformity in fermenters cannot be measured in real time. A dissolved oxygen probe gives one value — but the spatial reality across a large vessel is often far from uniform. Yield variability persists batch to batch without a clear root cause.
The quantropIQ sensor resolves the full fermenter cross-section at over 1,000 frames per second — capturing gas holdup distribution, bubble dynamics, and mixing progression continuously. Engineers can verify whether aeration and agitation are actually reaching the entire culture volume.
Single-point DO sensors report a local value. Gas distribution in large bioreactors is inherently non-uniform — one reading does not represent the bulk state of the culture.
Every cross-sectional frame shows the actual distribution of gas bubbles across the vessel diameter at millisecond resolution. Aeration uniformity becomes measured, not assumed.
Foam formation appears as a characteristic change in the phase distribution signature — before it reaches dangerous levels. Antifoam is dosed reactively, not preventively.
The physical state of the broth in the final fermentation stage has a measurable spatial signature. Endpoint is determined by process state — not elapsed time.
Flooding, weeping, and liquid maldistribution are detected through indirect indicators: pressure drop, temperature profiles, product quality. By the time these register, the column is already underperforming — and recovery takes time and energy.
Inline sensors mounted at column cross-sections provide direct measurement of liquid and vapor distribution, holdup dynamics, and flow regime transitions. Flooding onset becomes an observable event, not an inferred one.
dP across a column tray gives one scalar value. It cannot distinguish flooding from weeping, or identify which section is maldistributed.
The spatial distribution of liquid across a column cross-section — resolving radial non-uniformities, weeping zones, and entrainment patterns that dP cannot distinguish.
Flooding onset has a characteristic spatial signature — liquid holdup distribution changes measurably before column performance degrades. Predictive alerts become physically grounded.
When actual internal column state is known, reboiler and reflux parameters are adjusted to the efficiency boundary — not a conservative margin from it.
Flow regime determines mass transfer, reaction rate, and mixing efficiency — but is not directly measured. It is inferred from process conditions. Slug, bubble, and stratified regimes have fundamentally different mass transfer characteristics that existing sensors cannot distinguish in real time.
The sensor resolves the full cross-sectional phase distribution at millisecond resolution — providing direct, continuous identification of flow regime, local phase fractions, bubble dynamics, and interfacial area estimates.
Flow regime is estimated from superficial velocities using flow maps — derived from lab data, rarely valid for actual operating fluids and geometries.
Real-time classification of bubble, slug, churn, annular, and stratified flow from the spatial phase distribution at 1,000+ frames per second.
With flow regime continuously identified, gas injection rate is closed-loop controlled to maintain the target regime — not fixed at a conservative design point.
Local and cross-sectional average phase fractions are directly measured — not inferred. Relevant for separator control, mass balance closure, and reaction conversion monitoring.
Mixing uniformity, concentration gradients, and phase distribution directly determine selectivity, yield, and product quality. Yet these parameters are inaccessible to conventional inline sensors — leaving engineers to rely on end-of-batch analytics and conservative operating margins.
Inline spatial sensing transforms these hidden variables into real-time observables. Mixing completion, concentration homogeneity, and reactive phase distribution become continuously measurable — enabling tighter process control and informed scale-up decisions.
Concentration and phase distribution are measured by taking samples and running offline analysis — hours later, at a single point. The process has already moved on.
The spatial distribution of conductivity and permittivity across the reactor cross-section correlates directly with concentration and phase composition — continuously, without sampling.
Spatial homogeneity is directly observable. Mixing is declared complete when the cross-sectional distribution is genuinely uniform — not after a fixed time or arbitrary sample check.
Each run generates a physical state signature. Comparing signatures across scales identifies conditions that must be preserved — reducing scale-up iterations and de-risking technology transfer.
Spatial process visibility unlocks improvements across every dimension of plant operation — from energy and yield to maintenance and knowledge transfer.
Spatial data reveals over-mixing, excess aeration, and heat distribution inefficiencies — allowing adjustment to what the physics actually requires.
Instabilities and concentration deviations are visible before they affect product quality — allowing intervention before the batch is at risk.
Uniform concentration fields and controlled reaction kinetics across the full cross-section — not inferred from a single point measurement.
Cycles end when the process is actually complete — not when a conservative timer expires. More batches per shift with the same assets.
Flow regime changes, foaming precursors, and instability signatures become early-warning signals — replacing reactive firefighting with proactive control.
Fouling and equipment degradation appear as changes in spatial flow signatures — maintenance based on actual condition, not fixed schedules.
Process fingerprints from existing plants transfer to new scales and sites — cutting scale-up iterations and reducing time-to-market for new formulations.
Process behavior encoded in physical models — not held tacitly by individuals. Transferable, reproducible, and progressively automated over time.
Five integrated layers from hardware sensing to autonomous process control — each building on the previous, designed for continuous industrial operation from day one.
The sensor mounts via standard industrial flange — no flow interruption, no sampling, no modification of the process vessel. A measurement grid spans the full cross-section, resolving spatial distribution of phases, concentrations, and flow structures at millisecond resolution.
At 1,000+ frames per second, the rapid cross-sectional sequence creates an effective 3D picture of flow structures — without the complexity or cost of volumetric scanning methods.
Conductivity and permittivity captured simultaneously across the full cross-section. Output is a space-time field where gas holdup, mixing quality, and phase instabilities are directly observable.
Embedded GPU compute per sensor. Multiple sensors aggregated and synchronized with auxiliary signals. Deterministic low-latency processing — fully on-premise.
Each moment is represented as a physical fingerprint — a structured spatial signature capturing gradients, flow patterns, and dynamic changes. Similar states produce similar fingerprints; deviations are measurable distances from a known baseline.
Physics-Informed Neural Networks (PINNs) combine measurement data with physical equations — enabling predictions, what-if analysis, and causal interpretation that purely data-driven models cannot provide.
Stability assurance, energy optimization, autonomous closed-loop control, scale-up acceleration, and cross-plant learning — each building on the physical understanding established in L1–L4.
Physical AI requires dense, spatially resolved, high-speed data. Most conventional measurement technologies cannot deliver this combination.
A structured, low-friction entry point. We configure for your process, install at your site, and deliver results you can evaluate before any long-term commitment.
We understand your process, equipment geometry, and measurement objectives — and define what success looks like for your team.
Sensor configured to your pipe geometry, fluid system, and operating conditions. EX/IP scope aligned with your site requirements.
Flange-based installation into your live process — no production stop. Sensor commissioned and baseline established with your process engineers on-site.
Continuous data collection during normal operation. Weekly sessions with your team translating spatial sensor data into process insights.
Structured review: what was visible, what insights were generated, and what operational improvements are quantifiable. Clear basis for evaluating full deployment.
A complete working deployment — not a demo. We bring the sensor, configure it for your process, and work alongside your team for the full duration.
Sensor configured to your pipe diameter, fluid system, and pressure/temperature range.
Sensor data streams alongside your existing process historian or DCS — no standalone island.
Our team works with yours during installation, commissioning, and the full monitoring period.
A structured findings document — what was measured, what it means, what it's worth to your operation.
We respond within 1 business day. No commitment required to start the conversation.
The platform applies wherever the gap between what's happening inside a process and what conventional sensors report has an economic consequence.
Reactive mixing control, concentration uniformity, selectivity optimization, and scale-up fingerprinting for complex multi-step synthesis routes.
Spatial aeration monitoring, foam detection, mixing uniformity, and fermentation endpoint determination across large-scale bioreactors.
Inline process understanding for regulated manufacturing — batch consistency, contamination precursor detection, and PAT integration.
Mixing homogeneity, phase transition monitoring, emulsion stability, and batch-to-batch quality consistency for complex liquid food processes.
Distillation column optimization, separator control, two-phase flow monitoring, and energy efficiency improvement across continuous processes.
Crystallization monitoring, phase transition detection, and flow regime identification in polymerization and materials processing reactors.
The measurement principle and sensor technology are grounded in peer-reviewed research in multiphase flow measurement — packaged as a production-ready industrial system.
The spatial measurement approach builds on peer-reviewed science in multiphase flow tomography — with a measurement principle and calibration methodology that is physically interpretable and not a black box.
Designed for continuous operation from the start: flange-mounted, IP and EX certified (developed jointly with plant operators), embedded compute, and compatible with industrial pressure and temperature envelopes.
The system is currently deployed in pilot projects with chemical and biotech manufacturers. We work alongside process engineering teams — not around them — and results are shared transparently throughout.
Whether you're a process engineer looking to solve a specific measurement problem, or a plant manager evaluating new monitoring technology — we'd like to understand your process and show you what's possible.